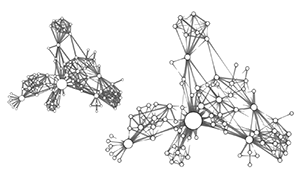
Sticky Links: Encoding Quantitative Data of Graph Edges
IEEE Transactions on Visualization and Computer Graphics, 2024.
[ Paper (0.4 MB)]
[ Source Code (Python)]
[ My Talk at PacificVis 2024 (32.4 MB)]
In this work we propose a new edge drawing for node-link diagram, Sticky Links. Using the metaphor of stickiness, sticky links can be used for expressive edge quantatitive encoding.
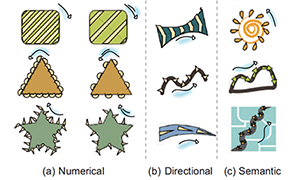
Enhancing Static Charts with Data-driven Animations
IEEE Transactions on Visualization and Computer Graphics, 2022.
[ Paper (1.82 MB)]
[ Project Homepage ]
[ Source Code (Javascript)]
In this work we propose data-driven animation to bring static charts to life, with the purpose of encoding and emphasizing certain attributes of data, specifically of non-temporal data.
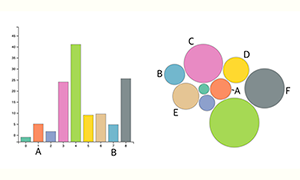
Modeling Just Noticeable Differences in Charts
IEEE Transactions on Visualization and Computer Graphics, 2021.
[ Paper (2.1 MB)]
[ Experiment Data ]
[ My Talk at VIS 2021 ]
In this work, we model the perception of Just Noticeable Differences (JNDs) in charts with two variables (intensity and distance) and find that JND grows as the exponential function.
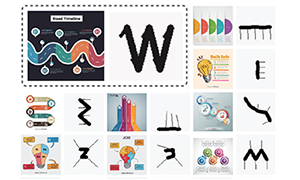
Exploring Visual Information Flows in Infographics
Proceedings of the 2020 CHI conference on human factors in computing systems, 2020.
[ Paper (2.0 MB) ]
[ InfoVIF dataset ]
[ Demo Video (MP4, 21.1 MB) ]
[ My Talk at CHI 2020 ]
In this work, we propose Visual Information Flow (VIF) in infographics and present an framework to extract it in a wild dataset InfoVIF, by which the VIF design patterns are explored.
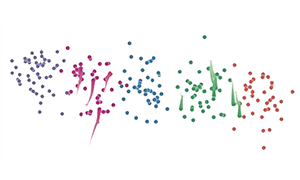
Temporal Scatterplots
Computational Visual Media, 2020.
[ Paper (1.6 MB) ]
In this work, we present TPlot visual method based on Principle Component Analysis (PCA) to set a projection plane that balances the directions of temporal change and spatial variance.
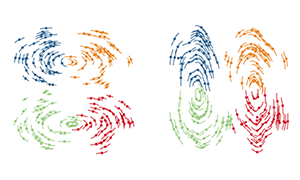
Winglets: Visualizing Association with Uncertainty in Multi-class Scatterplots
IEEE Transactions on Visualization and Computer Graphics, 2019.
[ Paper (2.7 MB) ]
[Source Code (Python) ]
[ My Talk at VIS 2019 ]
In this work, we present Winglets, which are designed as a pair of dual-sided strokes, leveraging the Gestalt principle of Closure to shape the perception of the form of the clusters.
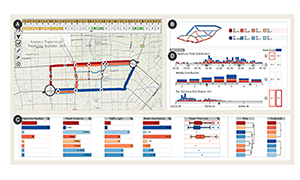
Visual Analysis of Multiple Route Choices based on General GPS Trajectories
IEEE Transactions on Big Data, 2017.
[ Paper (1.2 MB) ]
In this work, we present a visual analytic system, to help users interact with the large-scale trajectory data, compare different route choices, and explore the underlying reasons.
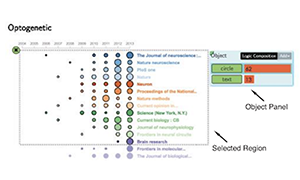
Interaction+: Interaction Enhancement for Web-based Visualizations
In Proceedings of IEEE Pacific Visualization Symposium (PacificVis 2017), Seoul, Korea. April 18-21, 2017.
[ PDF (1.5 MB) ]
[ MP4 (14.9 MB)]
In this work, we present Interaction+, an application-independent tool that enhances the interactive capability of existing web-based visualizations without accessing its data.